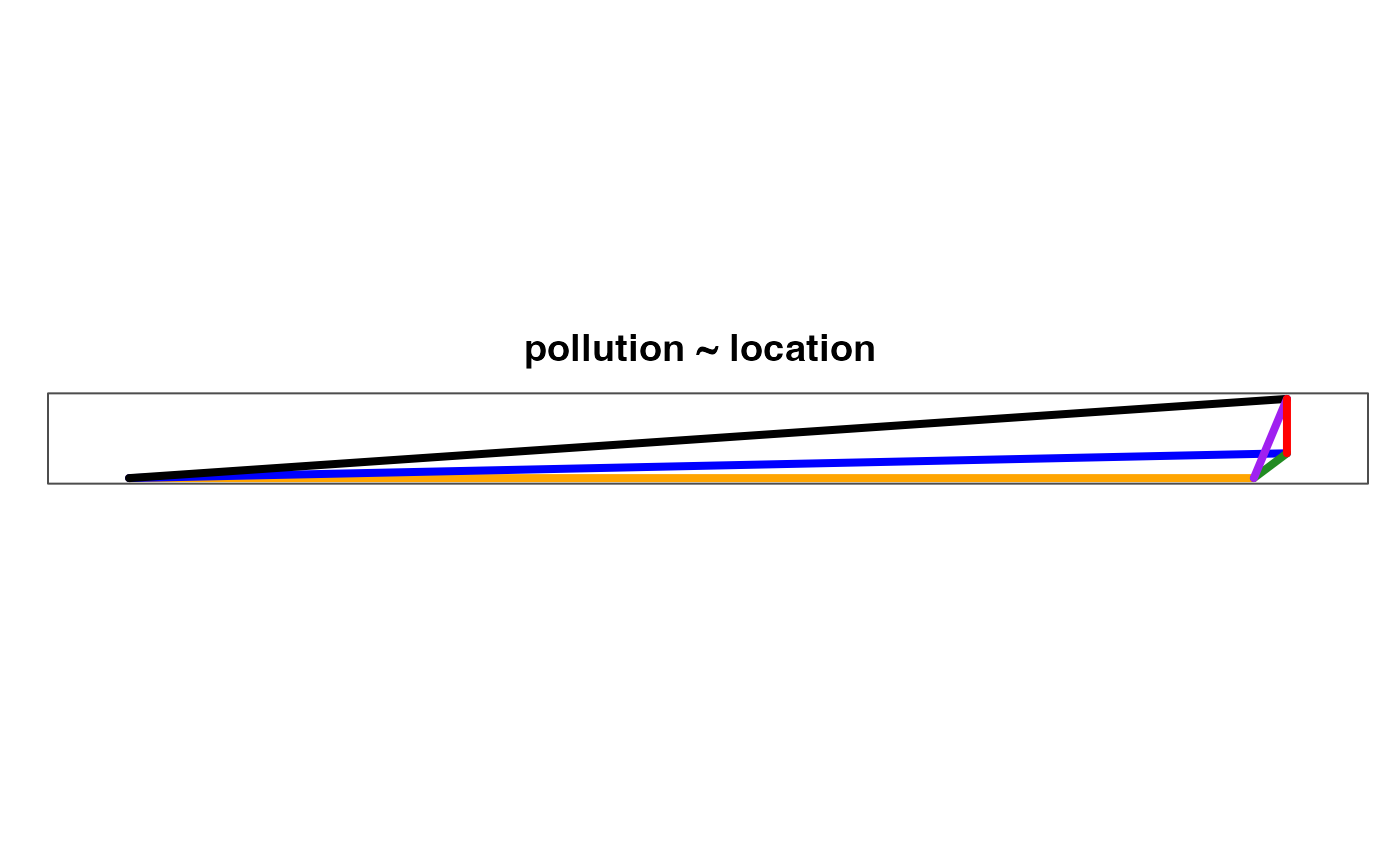
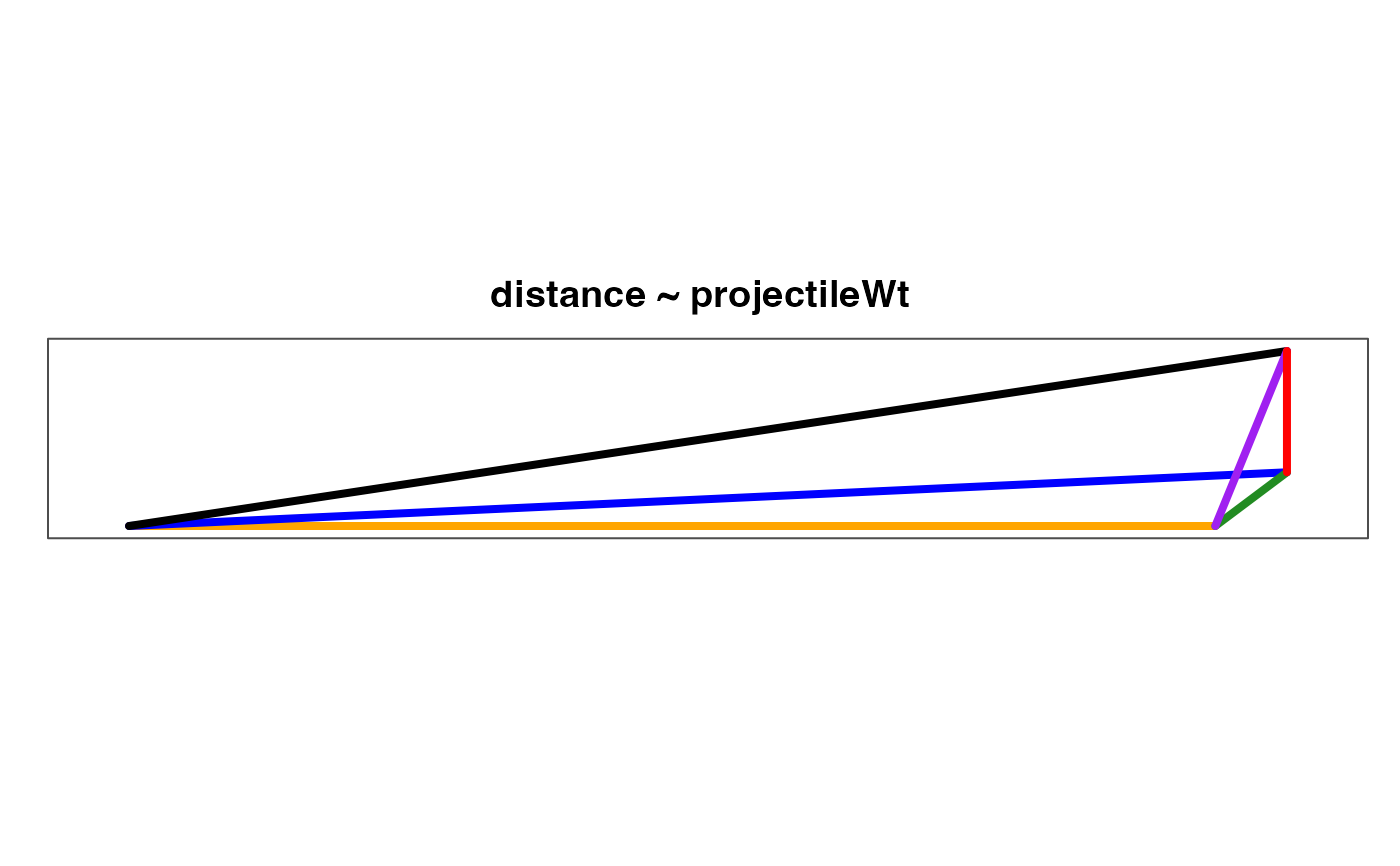
geolm create a graphical representation of the fit of a linear model.
Usage
geolm(formula, data = parent.env(), type = "xz", version = 1, plot = TRUE, ...)

to2d(x, y, z, type = NULL, xas = c(0.4, -0.3), yas = c(1, 0), zas = c(0, 1))
Arguments
- formula
a formula as used in
lm.- data
a data frame as in
lm.- type
character: indicating the type of projection to use to collapse multi-dimensional data space into two dimensions of the display.
- version
an integer (currently
1or2). Which version of the plot to display.- plot
a logical: should the plot be displayed?
- ...
other arguments passed to
lm- x, y, z
numeric.
- xas, yas, zas
numeric vector of length 2 indicating the projection of
c(1,0,0),c(0,1,0), andc(0,0,1).
See also
lm.