The paletts data set contains data from a firm that recycles paletts. Paletts from warehouses are bought, repaired, and resold. (Repairing a palette typically involves replacing one or two boards.) The company has four employees who do the repairs. The employer sampled five days for each employee and recorded the number of pallets repaired.
Format
A data frame with 20 observations on the following 3 variables.
- pallets
number of pallets repaired
- employee
a factor with levels
ABCD- day
a factor with levels
day1day2day3day4day5
Examples
data(Pallets)
# Do the employees differ in the rate at which they repair pallets?
pal.lm1 <- lm(pallets ~ employee, data = Pallets)
anova(pal.lm1)
#> Analysis of Variance Table
#>
#> Response: pallets
#> Df Sum Sq Mean Sq F value Pr(>F)
#> employee 3 236.95 78.983 2.4415 0.1019
#> Residuals 16 517.60 32.350
# Now using day as a blocking variable
pal.lm2 <- lm(pallets ~ employee + day, data = Pallets)
anova(pal.lm2)
#> Analysis of Variance Table
#>
#> Response: pallets
#> Df Sum Sq Mean Sq F value Pr(>F)
#> employee 3 236.95 78.983 24.428 2.134e-05 ***
#> day 4 478.80 119.700 37.021 1.162e-06 ***
#> Residuals 12 38.80 3.233
#> ---
#> Signif. codes: 0 ‘***’ 0.001 ‘**’ 0.01 ‘*’ 0.05 ‘.’ 0.1 ‘ ’ 1
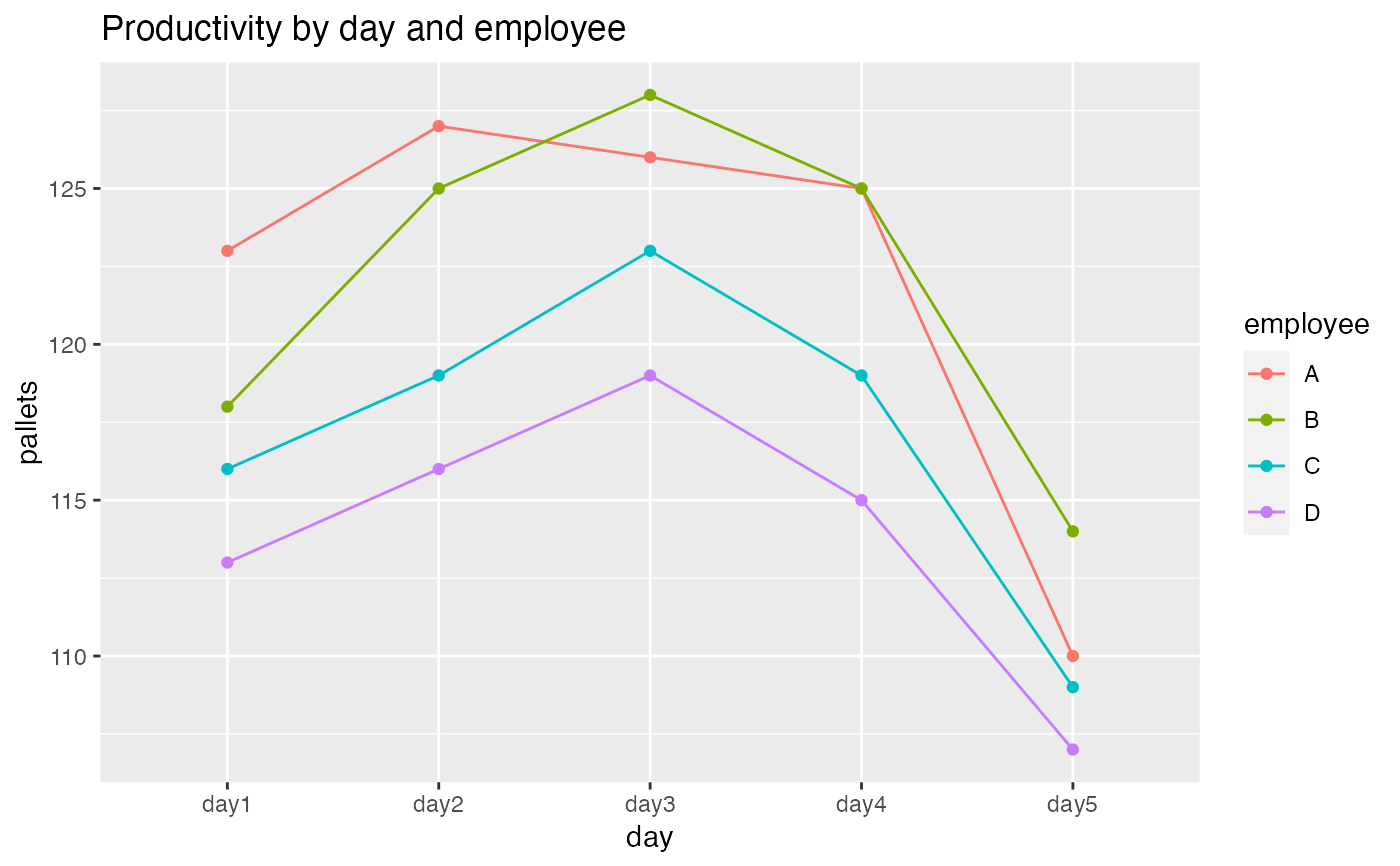
gf_line(pallets ~ day, data = Pallets,
group = ~employee,
color = ~employee) %>%
gf_point() %>%
gf_labs(title = "Productivity by day and employee")