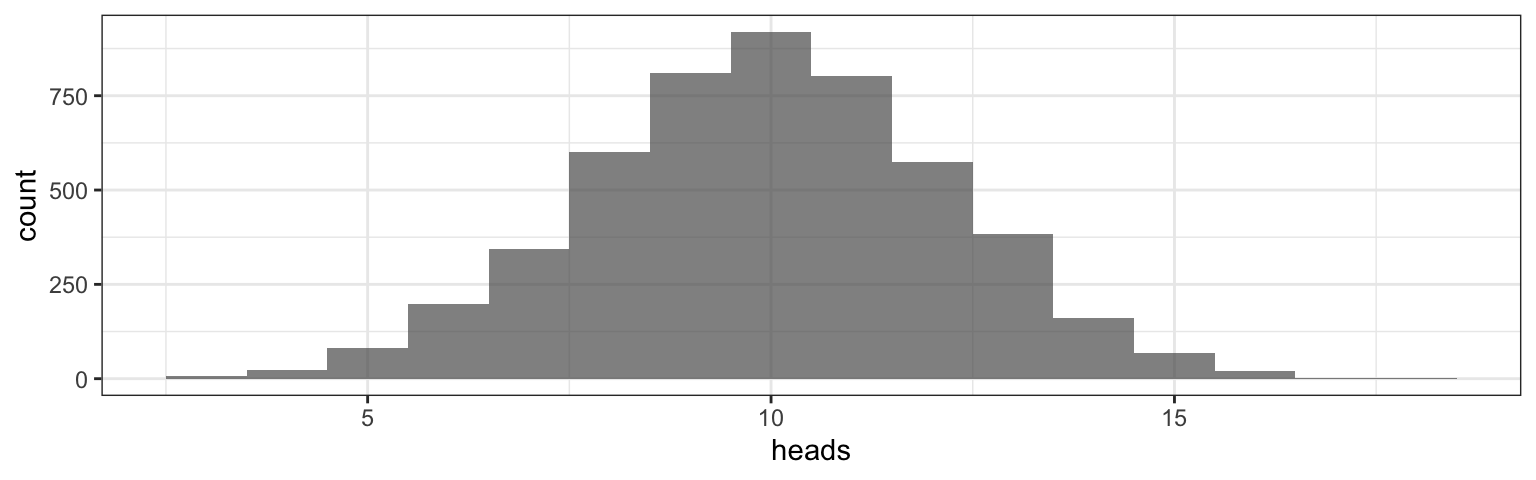
How unusual would it be for a random guesser to correctly identify 18 cups out of 20?
The Role(s) of Computation
introduce concepts/ideas
emphasize big ideas
confirm (or alter) intuition
support applications
Note: In my classes I end up having to clarify when I’m not looking for a purely computational (simulation) solution to a probability problem. For many of my students, simulations become their go-to method for answering probability questions.
Adjustment #3: Role of Probability
Probability then Statistics\(\rightarrow\)Probability FOR Statistics
Include basics of inference in first semester (tests, intervals, power, simulation-based methods).
Use statistical goals to motivate learning probability.
Lady Tasting Tea
\(\rightarrow\) Binomial distributions
\(\rightarrow\) Binomial Test (and Normal approximation)
\(\rightarrow\) Power
Probability For Statistics
Dennis Sun (JSM 2020) has an even better name for this:
Triple Immersion in Probability, Statistics, and Computation
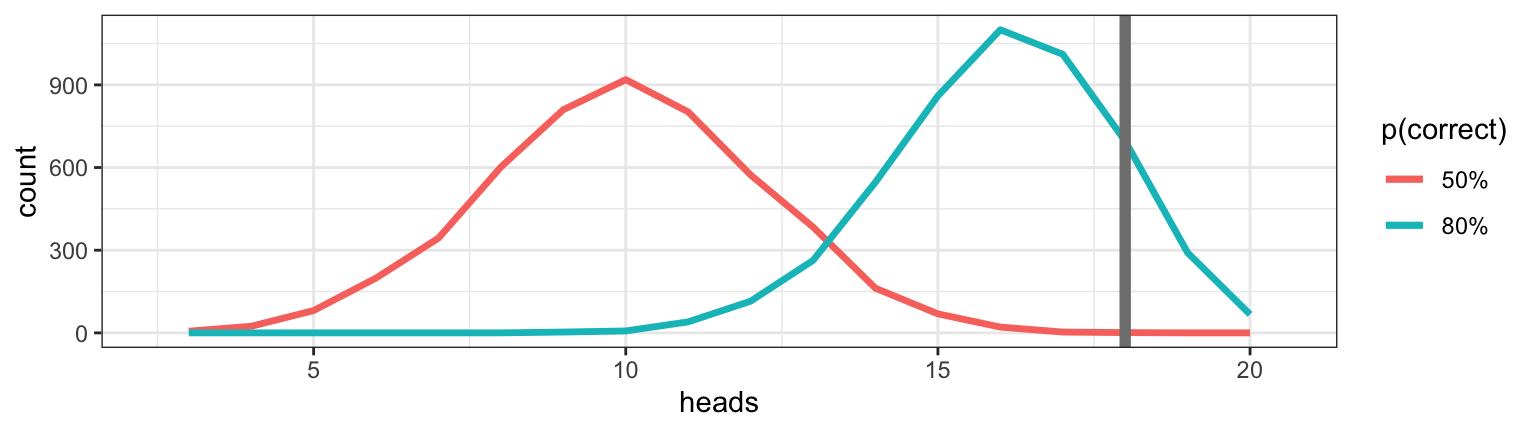
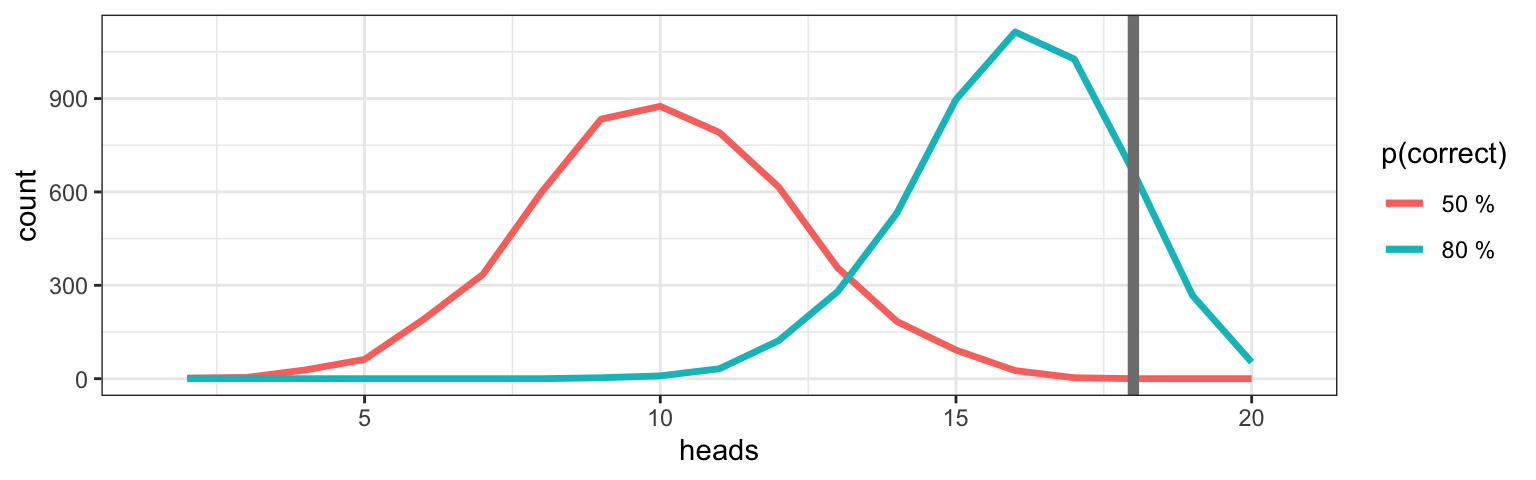
Continuing our Example: Power
Suppose the Lady can correctly distinguish the mixing order 80% of the time,
How likely is she to pass our test (get \(\ge\) 18 of 20 correct)?
Sims80 <-do(5000) *rflip(20, 0.8) # Correct 80% of the time gf_freqpoly(~ heads, binwidth =1, data = Sims, color =~"50%") |>gf_freqpoly(~ heads, binwidth =1, data = Sims80, color =~"80%") |>gf_vline(xintercept =~18, color ="gray50", size =2) |>gf_labs(color ="p(correct)")
Can come back later and work out power using binomial (or normal) distributions if we like.
Power: Generalizing
Fill in the blanks:
If the Lady can correctly distinguish the mixing order ____ % of the time, how likely is she to pass our test?
(pass = get \(\ge\) ____ of ____ correct)
Easy enough to modify our code above for any particular case,
but there is a better way…
power <-function() { Null <-do(reps) *rflip(n, null) Alt <-do(reps) *rflip(n, alt) }
Use existing code as template.
Identify which values could be changed.
Power via Functions
power <-function(null =0.5, alt =0.8, n =20, reps =5000) { Null <-do(reps) *rflip(n, null) Alt <-do(reps) *rflip(n, alt) }
Use existing code as template.
Identify which values could be changed and make them function arguments.
Power via Functions
power <-function(null =0.5, alt =0.8, n =20, threshold =18, reps =5000) { Null <-do(reps) *rflip(n, null) Alt <-do(reps) *rflip(n, alt) labs <-paste(100*c(null, alt), "%")gf_freqpoly(~ heads, binwidth =1, data = Null, color =~ labs[1]) |>gf_freqpoly(~ heads, binwidth =1, data = Alt, color =~ labs[2])|>gf_vline( xintercept =~ threshold, color ="gray50", size =2) |>gf_labs(color ="p(correct)")}
power(null =0.5, alt =0.8, n =20, threshold =18)
Power via Functions
power <-function(null =0.5, alt =0.8, n =20, threshold =18, reps =5000) { Null <-do(reps) *rflip(n, null) Alt <-do(reps) *rflip(n, alt) typeI <-prop( ~ (heads >= threshold), data = Null) power <-prop( ~ (heads >= threshold), data = Alt)c(typeI, power) |>setNames(c('type I', 'power'))}power(null =0.5, alt =0.8, n =20, threshold =18)
type I  power
0.0006 0.2058
Power: Experimenting
power(null =0.5, alt =0.9, n =15, threshold =13)
type I  power
0.0026 0.8224
power(null =0.5, alt =0.9, n =20, threshold =18)
type I  power
0.0004 0.6770
power(null =0.5, alt =0.9, n =20, threshold =18)
type I  power
0.0000 0.6766
Leads to more questions:
How precise are these answers? (0? 0.0000 vs 0.0004?)
How many replications should we use?
Can we avoid using simulations? Are there advantages?
Power via Functions
The ability to turn one-offs into reusable functions is a key skill for students to develop.
Helps them understand how R works
Also helps them think through 2 important questions
What do I want the computer to do for me?
What does it need to know to do that?
More reproducible; faster exploration
Computation in Prob/Stats sequence
These days the use of computation in a statistics class is not so controversial.
Allows us to use larger, more interesting data sets
Allows us to focus attention on the right parts of the task
Allows us to teach reproducible analysis methods (e.g., RMarkdown/Quarto, scripting, functions, packages)
Computation (and statistics) can also support learning probability.
Poisson and Exponential
We can use the connection between the two distributions
to help students shake a common misunderstanding of the Poisson rate parameter \(\lambda\).
vs.
Poisson Exercise
After a 2010 NHL play-off win in which Detroit Red Wings wingman Henrik Zetterberg scored two goals in a 3-0 win over the Phoenix Coyotes, Detroit coach Mike Babcock said, ``He’s been real good at playoff time each and every year. He seems to score at a higher rate.”
Do the data support this claim? In \(506\) regular season games, Zetterberg scored \(206\) goals. In \(89\) postseason games, he scored \(44\) goals. Goal scoring can be modeled as a Poisson random process. Assuming a goal-scoring rate of \(\frac{206}{506}\) goals per game, what is the probability of Zetterberg scoring \(44\) or more goals in \(89\) games?
How does this probability relate to Coach Babcock’s claim?
What about multiple comparisons/players?
Isn’t 206/506 also just an estimate?
Stat 344: First Exam Problem
Problem 1<Details omitted>
What is the maximum likelihood estimate for \(\theta\)?
If we test the null hypothesis that \(\theta = 2.5\), what is the p-value?
What is the 95% likelihood confidence interval for \(\theta\)?
Could start several ways
Provide (log) likelihood function.
Provide data and model.
Could require numerical or analytical approaches.
But some of my students were getting lost in the details (logs, derivatives, numerical optimizers, etc.), so …
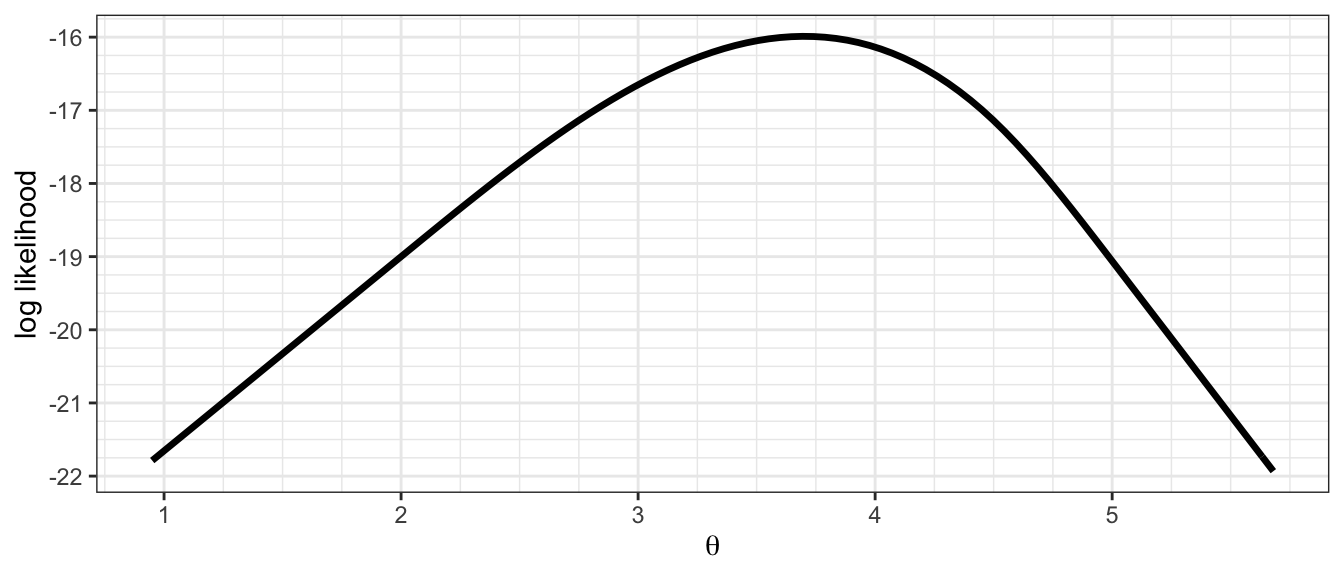
Stat 344: First Exam Problem
Below is a graph of a log likelihood function \(l(\theta)\) for a data set with \(n = 23\).
Using the information provided, answer the following questions as accurately as you can.
What is the maximum likelihood estimate for \(\theta\)?
If we test the null hypothesis that \(\theta = 2.5\), what is the p-value?
What is the 95% likelihood confidence interval for \(\theta\)?
Visualizing Likelihood
maxLik + fastR2 make it easy to visualize likelihood (for one parameter).
ml <-maxLik2(loglikelihood, start =c(theta =2), x = data)plot(ml, ci =c("lik", "wald"))
More examples
Golfballs in the Yard \(\to\) Test Stats/Null Distributions/GOF
How many replicates do I need (to estimate a p-value)?
Robustness: Is the coverage rate in my simulation consistent with nominal value?
If two iid samples of size \(n\) are drawn from the same normal distribution, what is the probability that the mean of the second sample will lie in the 95% CI produced by the first sample?
Summary
Take advantage of the interplay between probability, statistics, and computation.
Take all those good ideas from Intro Stats and adapt them for Probability & Math Stats.
(Hint: Sometimes adapt = use without modification.)