Depends a bit on your specialty. Here’s what it says for Mechanical Engineering:
Numerical methods (e.g., approximations, precision limits, error propagation, Taylor’s series, Newton’s method)
Probability distributions (e.g., normal, binomial, empirical, discrete, continuous)
Measures of central tendencies and dispersions (e.g., mean, mode, standard deviation, confidence intervals)
Expected value (weighted average) in decision making
Regression (linear, multiple), curve fitting, and goodness of fit (e.g., correlation coefficient, least squares)
Sources:
1. What is most nearly the sample standard deviation of the following data set? {4, 6, 9, 9}
a) 2.1 b) 2.4 c) 4.5 d) 6.0
Notes
x <- c(4, 6, 9, 9)
sd(x)
var(x)
sum( (x - mean(x))^2 / 3)
sum( (x - mean(x))^2 / 4)
sum( (x - mean(x))^2 / 4) %>% sqrt()
## [1] 2.45
## [1] 6
## [1] 6
## [1] 4.5
## [1] 2.122. Four fair dice are thrown. What is the probability of rolling at least one six?
# 1 minus no sixes
1 - (5/6)^4
1 - dbinom(0, 4, 1/6)
## [1] 0.518
## [1] 0.5183. A bag contains 100 chips numbered 1 to 100. One chip is drawn from the bag. What is the probability that the number on the chip selected will be odd or greater than 80?
a) 0.1 b) 0.5 c) 0.6 d) 0.7
Notes
Key thing: \(\operatorname{P}(A \operatorname{or}B) = \operatorname{P}(A) + \operatorname{P}(B) - \operatorname{P}(A \operatorname{and}B)\)
P(odd) = 0.5;
P(greater than 80) = 0.2;
0.5 + 0.2 = 0.7
P(both) = 0.1;
P(one or the other) = 0.5 + 0.2 - 0.1 = 0.6
You could also do this by counting how many of the 100 numbers are either odd or greater than 80.
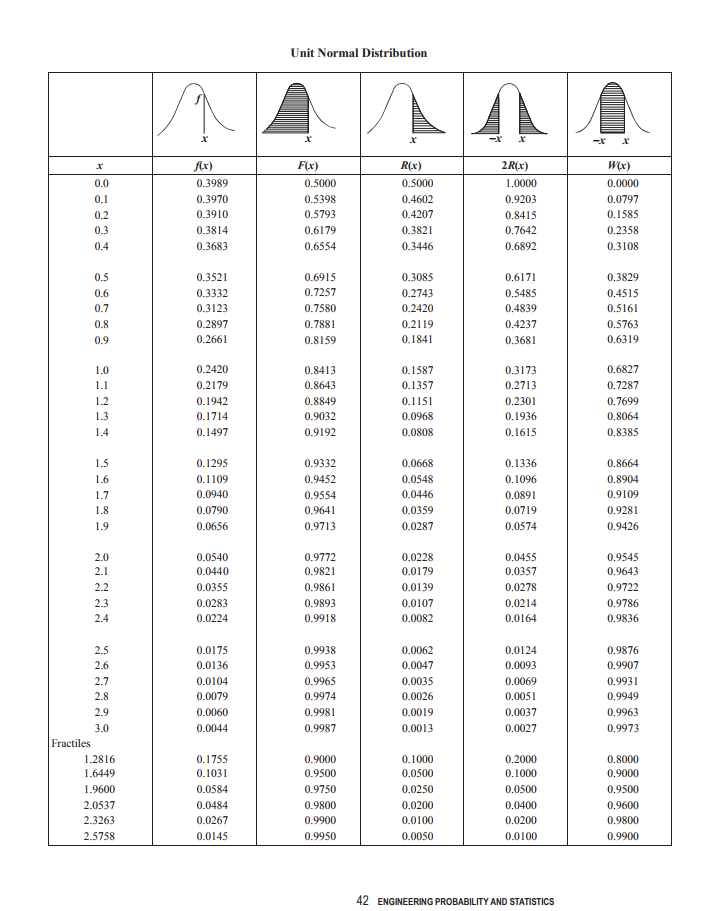
4. The final scores on a test are normally distributed with a mean of 72 and a standard deviation of 10. What is most nearly the probability that a student’s score will be between 65 and 78?
a) 0.4196 b) 0.4837 c) 0.5161 d) 0.6455
Notes
For the FE exam you will have access to a normal probability table like this one. Do this problem using that table. (Then check your work in R.)
Each column of the table could be computed in R, how would you do it? (Below is a fancy version that formats everything into a pageable table. Don’t worry about that part, just see if you know how to calculate any particular value in the table using R.)
tibble(
  x = seq(0, 3, by = 0.1),  # make a sequence from 0 to 3 by tenths
  `f(x)` = dnorm(x),
  `F(x)` = pnorm(x),
  `R(x)` =  1 - pnorm(x),
  `W(x)` = pnorm(x) - pnorm(-x)
) %>%
  round(4) %>%
  reactable::reactable()   # fancy table
pnorm(78, mean = 72, sd = 10) - pnorm(65, mean = 72, sd = 10)
# if we assume integer scores that are approximatley normal,
# we might use a "continuity correcttion"
pnorm(78.5, mean = 72, sd = 10) - pnorm(64.5, mean = 72, sd = 10) ## [1] 0.484
## [1] 0.5165. Four fair coins are tossed once. What is the probability of obtaining three heads and one tails?
a) 1/4 b) 3/8 c) 1/2 d) 3/4
There are only 16 possible outcomes, so you could list them all and count. But using what we know of binomial distributions is less tedious (and scales to problems of larger size.
dbinom(1, 4, 0.5)
4 * 0.5^1 * 0.5^3
choose(4, 1) * 0.5^1 * 0.5^3
## [1] 0.25
## [1] 0.25
## [1] 0.256. How many teams of 4 can be formed from 35 people?
a) about 25,000 b) about 2,000,000 c) about 50,000 d) about 200,000
Notes
choose(35, 4)
factorial(35) / (factorial(4) * factorial(35 -4))
## [1] 52360
## [1] 523607.
How many three-letter codes can be formed from the English alphabet if no repetitions are allowed?
a) \(26^3\) b) \(26/3\) c) \((26)(25)(24)\) d) \(26^3/3\)
Notes
This is related to the following probability problem: If a random three-letter code is selected (not repetitions allowed), what is the probability of selecting ABC?
The State of Michigan runs a lottery game that is similar to this, but uses digits rather than letters and allows for repetition. (It’s called Pick 3.) If you select 123, what is the probability that your lottery ticket is the winner?
# probability problem
prob <- 1/26 * 1/25 * 1/24; prob
# 1/prob is the number of possible codes
1/prob
# alternative solution
26 * 25  * 24
## [1] 6.41e-05
## [1] 15600
## [1] 156008. There are 10 defectives per 1000 products. What is the probability that there is one and only one defective in a random lot of 100?
a) \(99 \cdot 0.01^{99}\) b) \(0.01\) c) \(0.5\) d) \(0.99^{99}\)
Notes
Given the options here, one is approximately but not exactly correct. Why isn’t it exactly correct? Why is it a pretty good approximation.
What would the the exact probability be for this? (It’s a bit of a pain to compute unless you are clever in your use of R, so you don’t have to actually compute it.)
# Binomial approximation
100 * 0.01 * .99^99
dbinom(1, 100, 0.01)
## [1] 0.37
## [1] 0.37# Exact method
100 * 10/1000 * prod((990:892)/(999:901))
# this situation is is modeled by the Hypergeometric distribution
# R has a function for that distribution as well
dhyper(1, 10, 990, 100)## [1] 0.389
## [1] 0.3899. A set of six power measurements was made. The mean \(\dot{𝑄}\)̇ was 22450 W. The standard deviation from the six measurements was 846 W. Estimate the 95% confidence interval about the mean.
a) \(22450 \pm 691\) W b) \(22450 \pm 888\) W c) \(22450 \pm 1036\) W d) \(22450 \pm 1210\) W
Note: The FE exam has a t-distribution table too. It is a bit different. It is designed for computing critical values primarily. So you can look up the degrees of freedom and desired tail probability to get the value of \(t_*\). Here’s the table
# correct solution with t distribution
SE <- 846 / sqrt(6)
t.star <- qt(0.975, df = 5); t.star
SE * t.star

# if you incorrectly use the normal distribution (this explain choice a)
SE * 1.96
SE * 2
## [1] 2.57
## [1] 888
## [1] 677
## [1] 69110. An auto manufacturer has three plants (A, B, and C). Four out of 500 cars from Plant A must be recalled, 10 out of 800 from Plant B and 10 out of 1000 from Plant C. Now a customer purchases a car from a dealer who gets 30% of his stock from Plant A, 40% from Plant B, and 30% from Plant C, and the car is recalled. What is the probability it was manufactured in Plant A?
a) 0.0008 b) 0.010 c) 0.0125 d) 0.231
0.3 * 4/500 / (
  0.3 * 4/500 +
  0.4 * 10/800 +
  0.3 * 10/1000
)
## [1] 0.23111. Linear rgression is ued to plot a straight line through the following data points.
| x | y |
|---|---|
| 1 | 6 |
| 2 | 7 |
| 3 | 11 |
| 5 | 13 |
What is most nearly the slope of the regression line?
Notes
I hope you don’t get a problem like this one. But given enough time, you could compute the answer.
Make a (hand-drawn) sketch. How many answers can you rule out just from your sketch?
For the actual FE test, you get a reference book.
Take a look at it. How much do you recognize?
Notice that all the “nasty formulas” for the standard errors that R computes for you are there. Those are really tedious to use by hand.
The formulas presented don’t really promote good statistical thinking. Several of them are chosen to reduce the amount of button pushing on a calculator and take advantage of some algebraic identities. Compare the formula for the correlation coefficient given in these materials vs the one we saw in class. Which one is easier to remember? Which one tells you more about what the correlation coefficient is doing?
| term | estimate | std.error | statistic | p.value |
|---|---|---|---|---|
| (Intercept) | 4.143 | 1.197 | 3.461 | 0.07429 |
| x | 1.857 | 0.3833 | 4.845 | 0.04006 |